March 29, 2023
The planning of horizontal production wells has many potential areas of uncertainty, one being the difficulty in predicting the geological structure and stratigraphy that will be encountered down well. To help have greater certainty in the underlying geology along a planned well path, a pre-drill prognosis is devised to understand prognosed formation placement on a planned well and evaluate the associated risks with the planned trajectory. A key evaluation technique for this prognosis is to extract formation information in the form of logs to the planned trajectory to understand formation intersections along the well and lithology changes represented therein. One method to achieve this is to generate synthetic log responses along the planned well trajectory using offset wells and type logs to seek to predict what a curve may look like along the well trajectory. Using this synthetic log generation, geoscientists can then evaluate predicted log responses and place expected formation tops along the proposed well trajectory to evaluate KPIs and baselines such as expected percentage in the target zone, formation-based risks, and sub-seismic scale lithology changes.
The pick-based Horizontal Well Correlation (HWC) can help to resolve depth domain “Layer Cake” geological scenarios; however, recent developments have expanded this tool to handle more complex scenarios beyond a simplified “Layer Cake” model. With the addition of a HWC ‘Layers’ mode in the recent release of Geoscience Suite, a DecisionSpace® 365 solution, the HWC tool allows for the application of unique layering rules for each stratigraphic interval. These intervals are generated from Dynamic Frameworks to Fill® workflow software using the Complex Geology algorithm to resolve intricate stratigraphy which can include unconformities and fault networks. HWC ‘Layers’ extracts a predicted log curve from the evaluation of the entire structural model input, rather than simply extracting one interval at a time. Evaluating the entire structural model can help ensure that calculated predicted log results are from the correct stratigraphic interval at any given depth/position along the well path.
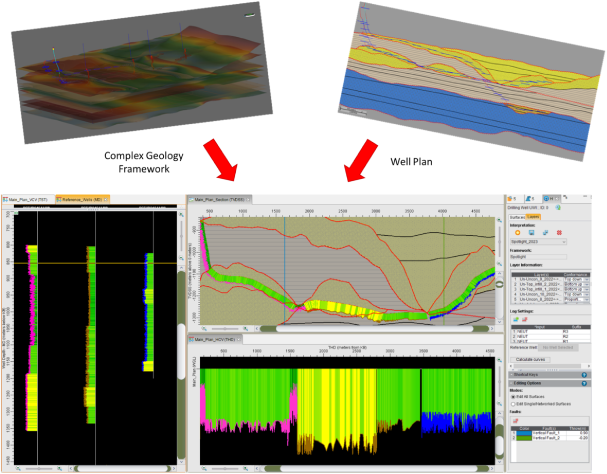
The HWC “Layers” UI (see Figure 1) allows easy and dynamic updates to be made to the synthetic log curves, through selecting and refining various options. With the selection of a 3D structural framework created in the Dynamic Frameworks to Fill® workflow software, HWC calculates the distribution of type log values as it relates to the selected conformance rules. The layers defined by this framework can be manipulated in the 2D section view of HWC by adding vertical faults or by utilizing constraint and anchor points to manually adjust the geologic structure. This hands-on editing mode can better suit the geoscientist by allowing them to match the well to the geology and regional structure instead of matching measured and predicted log signatures alone.
Figure 2 – Shows how the selection of a planned horizontal well path and Complex Geology Framework are translated to the HWC workspace. The Layer information intervals, taken from the chosen framework, are listed and fully editable within the Section Editor, accompanied by dynamic log response updates.
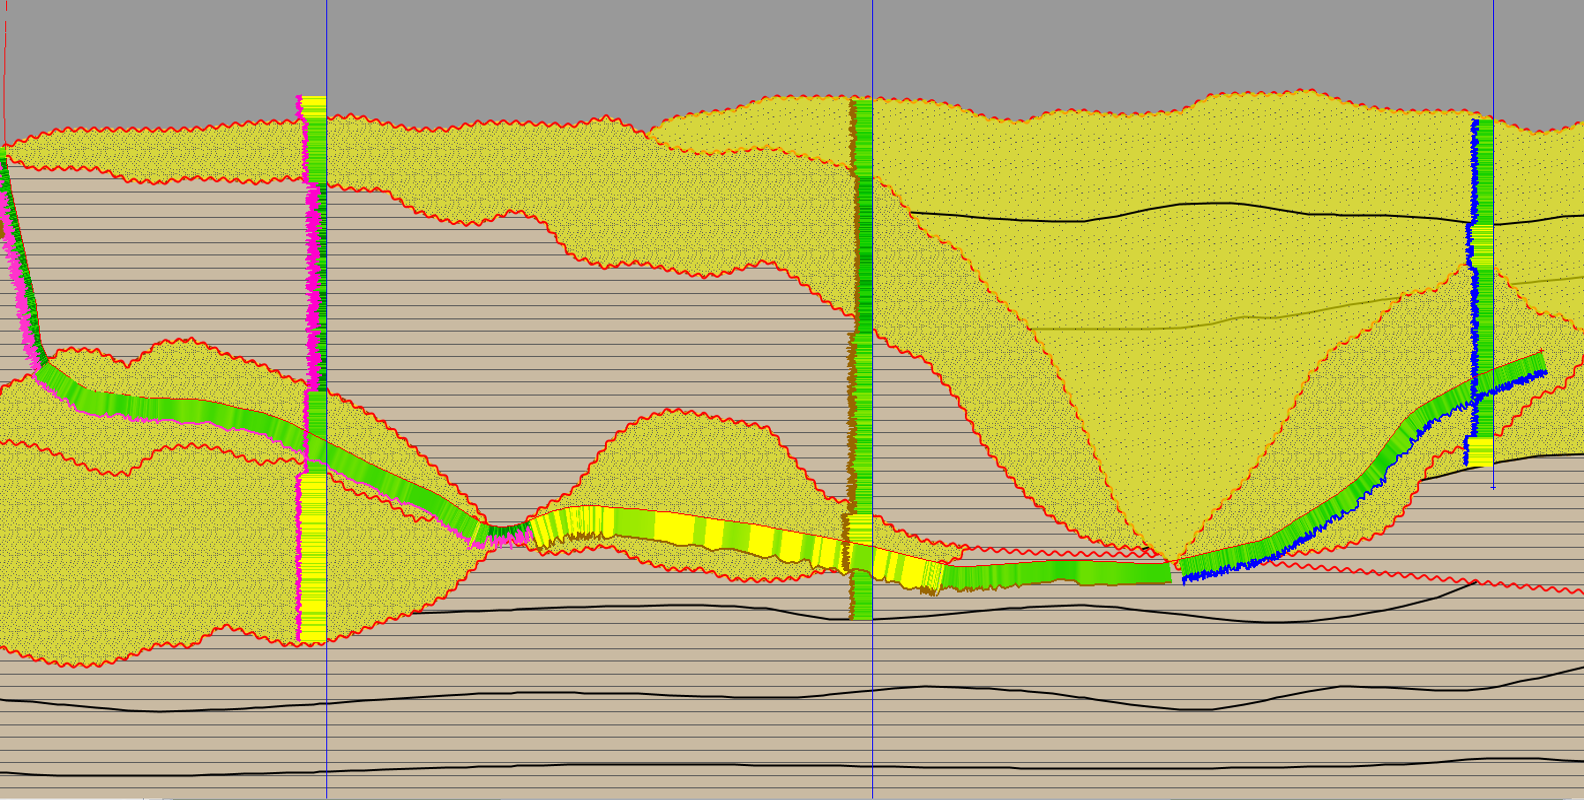
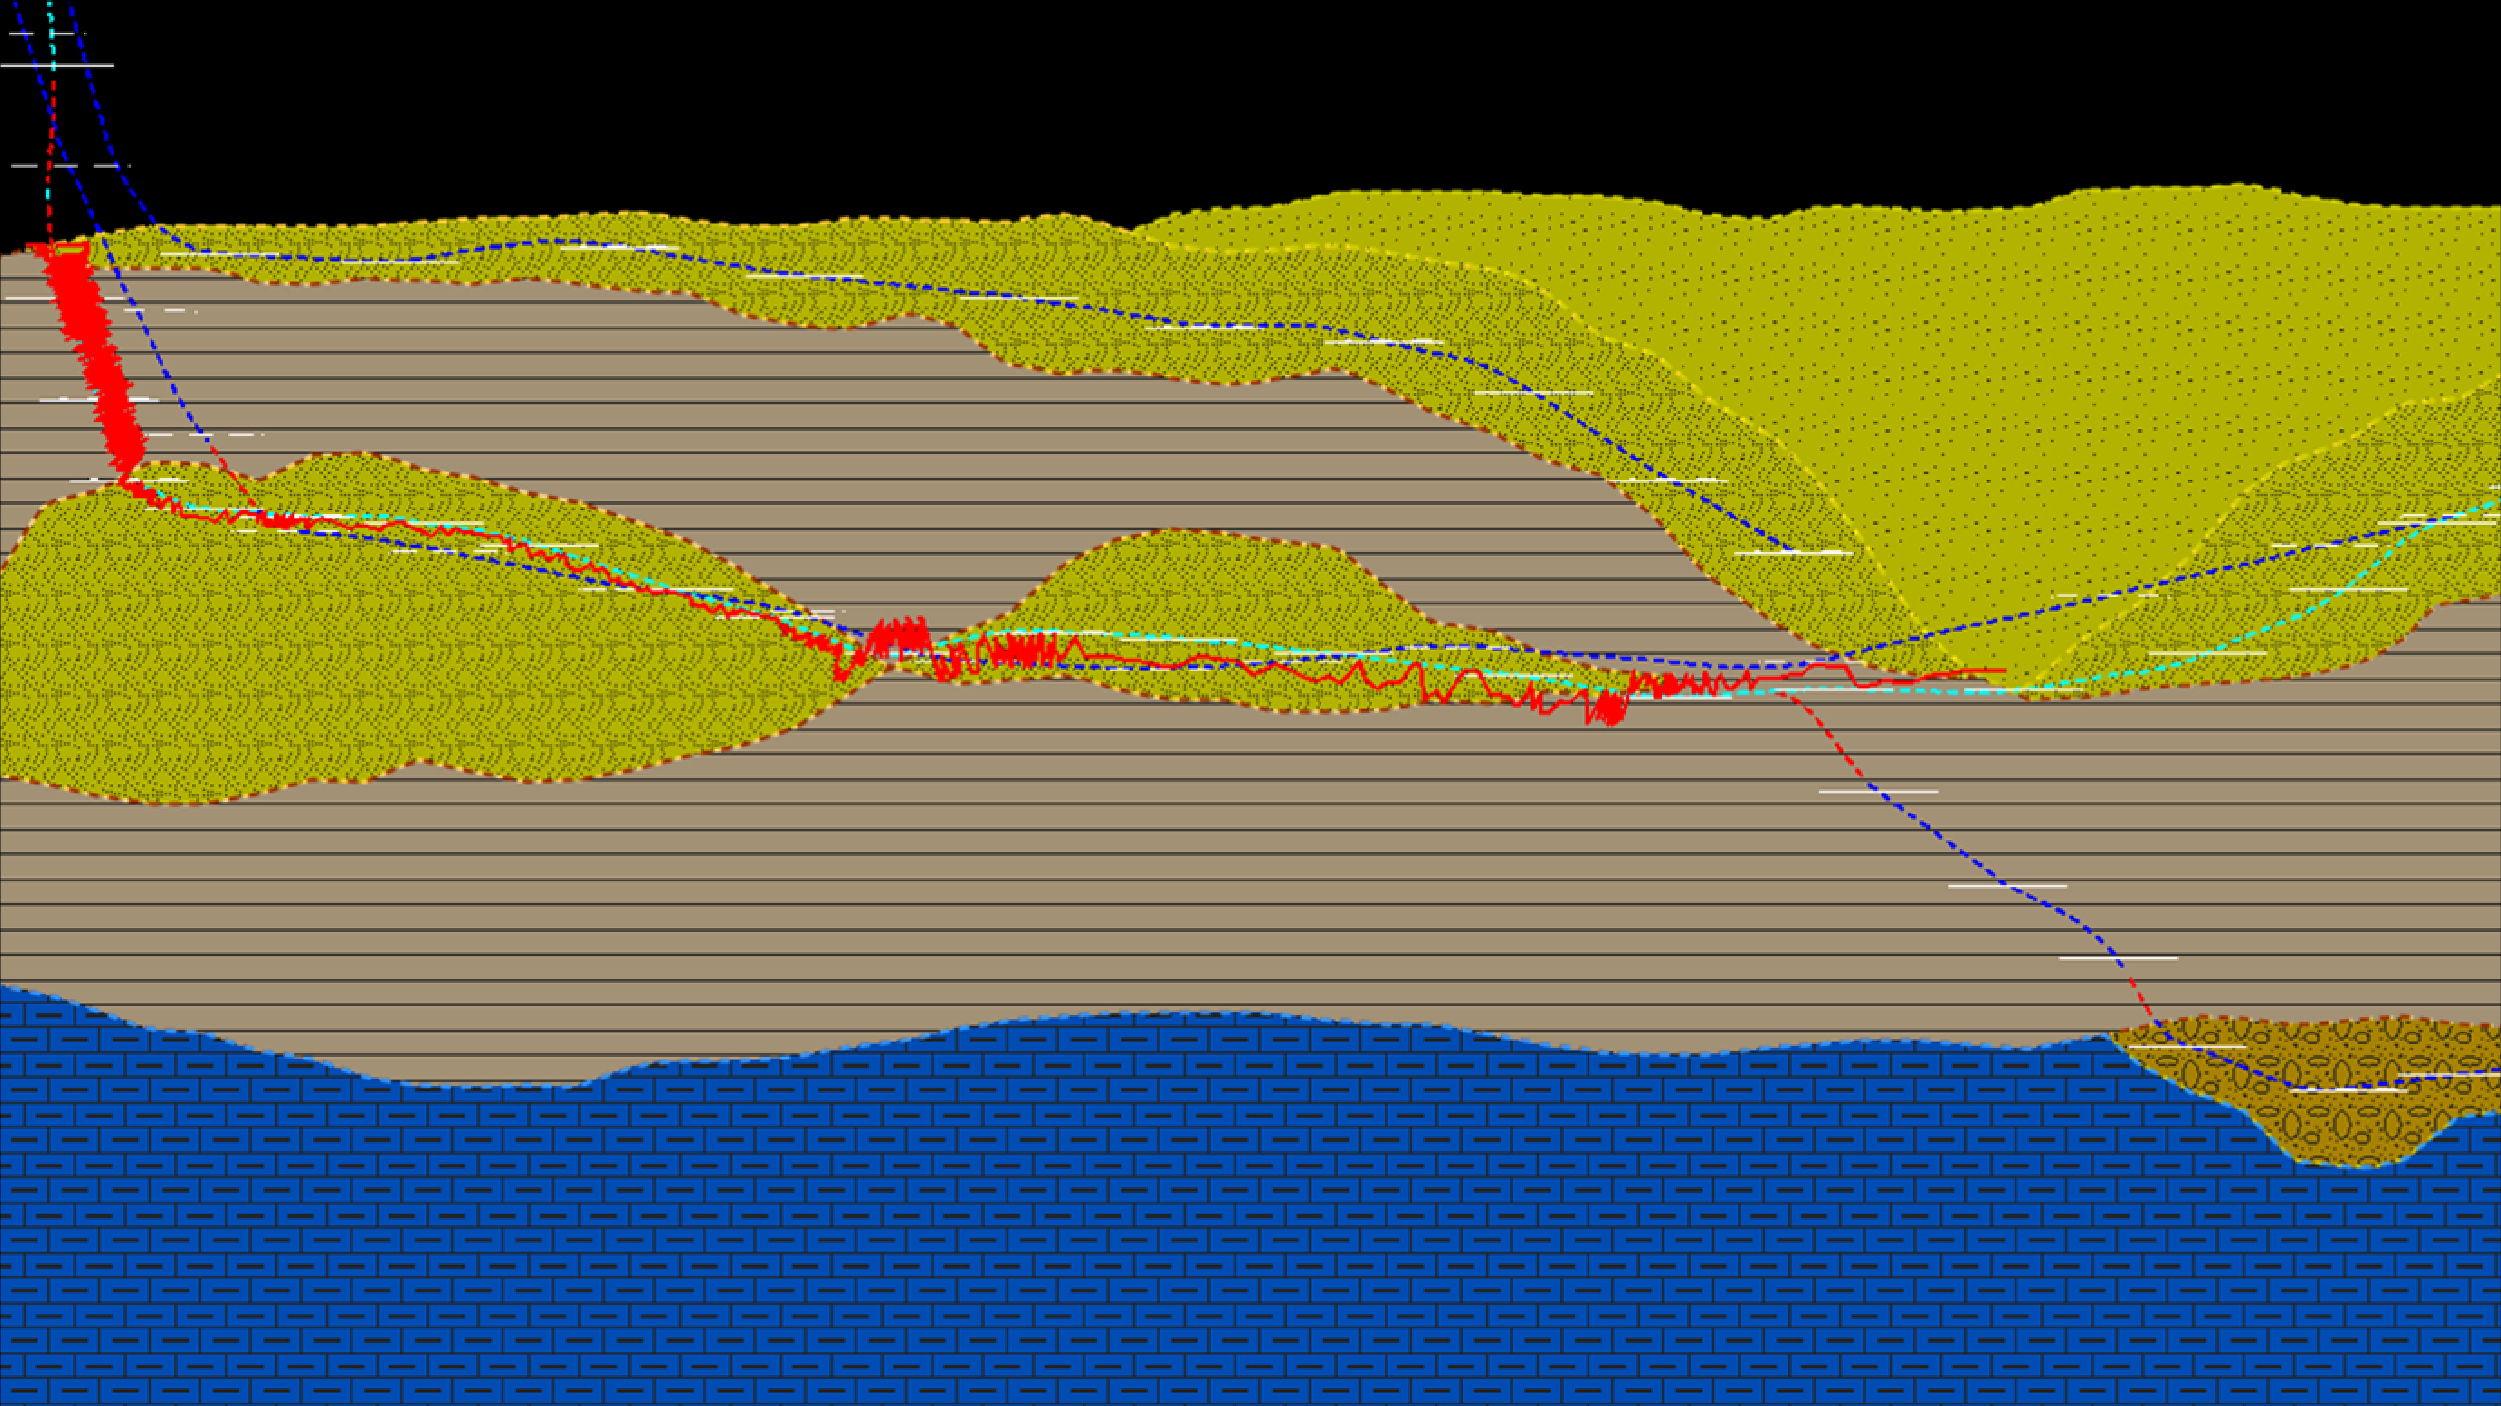
The application of HWC ‘Layers’ can be used to resolve complex geological settings such as: unconformity onlapping/offlapping and fault networks, by applying conformance-based layering rules. The layering rules allow the user to adapt intervals to geological scenarios, providing greater confidence that the synthetic log returns correct results, based on the stratigraphy encountered by the planned well path.
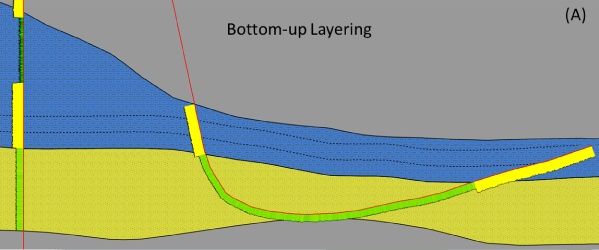
Available conformance rules are:
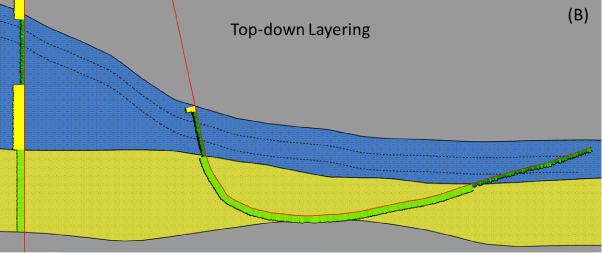
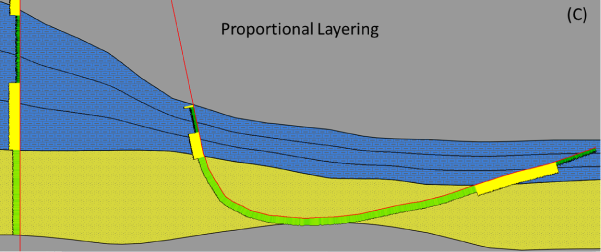
HWC ‘Layers’ combines conformance rule-based intervals and a 2D structural model derived from Dynamic Frameworks to Fill® workflow software, within a fully editable environment. This provides an intuitive workflow which helps to understand uncertainty in complex geological settings and provide a more accurate pre-drill prognosis of the subsurface.