November 18, 2022
Stratigraphic concepts are the backbone of good geological interpretations in sedimentary basins. The use of stratigraphy can help improve a subsurface model and ensure targets are in a geologically plausible location. Interpretation techniques that use stratigraphy can make the correlation of data between wells much easier, such as flattening on a pick or working in the True Stratigraphic Thickness (TST) domain. These techniques seek to remove the effect of dipping beds and a variable well path, so data are directly comparable.
The Geosciences Suite, a DecisionSpace® 365 solution, includes multiple tools to visualize and use stratigraphy to improve interpretations, such as the stratigraphic view, segmenting a well by turning points in stratigraphy, and automated stratigraphic column display. These tools assist in making it much easier to bring stratigraphy into the interpretation and check the quality of interpretations.
When working with well data, well tops are used to interpret the boundary between one rock type and the next. This sequence of well tops usually represents the lithostratigraphy but could also be used to capture the chronostratigraphy, sequence stratigraphy, or any other type of stratigraphy.
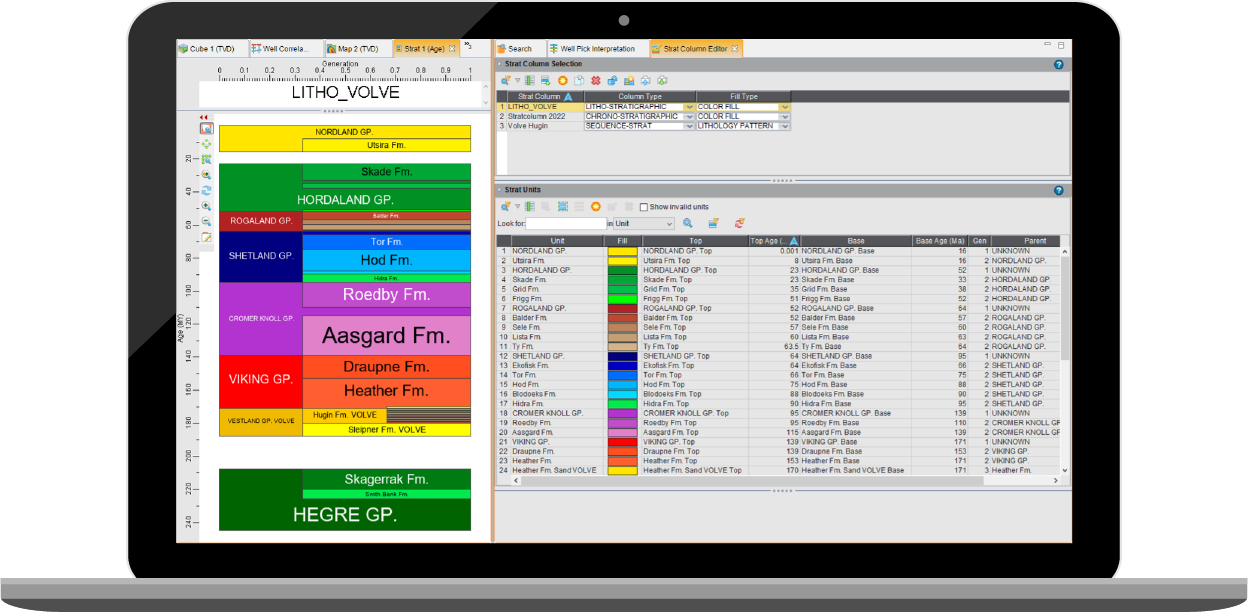
The stratigraphic sequence derived from multiple wells is commonly standardized into a regional stratigraphic chart which aims to represent a continuous record of sediments that are deposited over time. This can be displayed in the stratigraphic column view (Figure 1) and helps guide interpretations of the subsurface. Whenever new wells are planned, drilled, and interpreted in the region, the stratigraphic column can be used as a visual guide for which rock formations are expected.
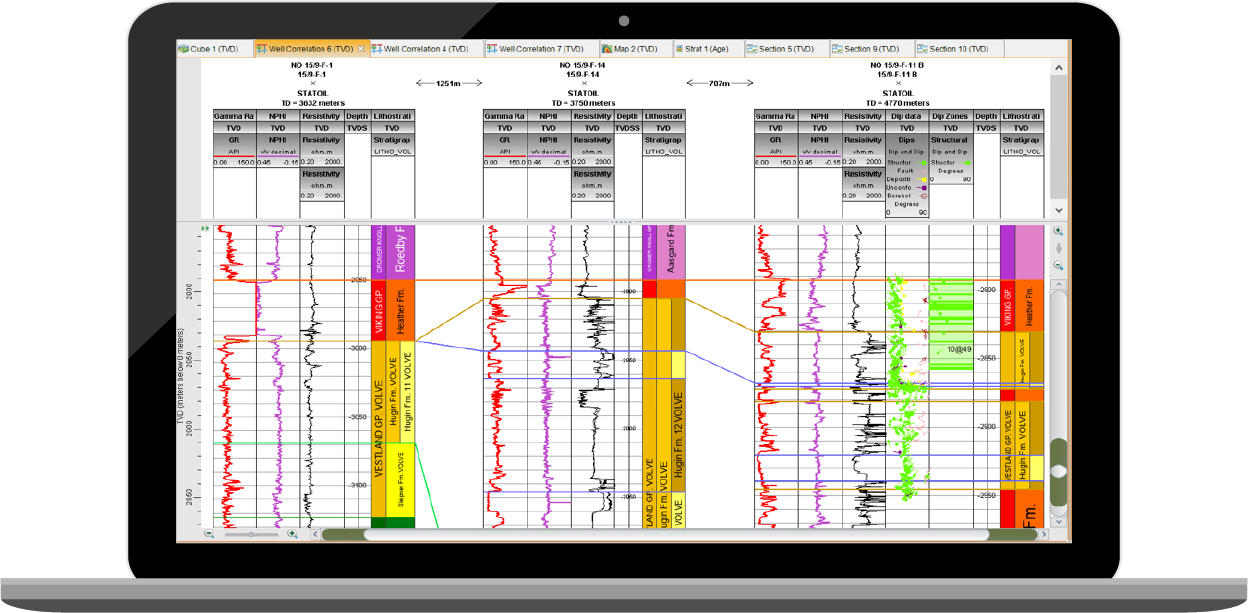
The stratigraphy within a particular well can be different from regional stratigraphy. For example, a local erosional event might have occurred in the area, or a formation may onlap and pinch out where the well is drilled and so some rock formations are missing in that well. Variations in a well can also be due to faulting, folding, or a horizontal well path which can cause repeated or reversed stratigraphy to be seen in the well. Reversed stratigraphy is where older rocks are encountered before younger rocks during drilling. Due to these variations, displaying the stratigraphy on a specific well while interpretations are being made, is essential to easily visualize how the data correlates with other wells in the region (Figure 2). This is especially useful in section view to validate the horizon interpretation or to identify inconsistencies in the interpretation and to visualize how the stratigraphy changes between the wells.
The new display option automates the creation of stratigraphic units in a well when well tops (surface pick data type) are created, and it uses inbuilt logic to ensure that geological rules are adhered to. This allows the new display option to act as a quality check tool because when the well tops don’t follow a geologically plausible pattern, then the stratigraphic column in the well will display gaps that highlight that there is an issue in the interpretation.
The logic means that only the well tops for the formations need to be interpreted and the group will automatically display. In addition, the logic accounts for complex geological scenarios such as faulting and folding by identifying where reverse stratigraphy has been interpreted and displays the stratigraphic column correctly. When a faulted pick qualifier is added to a well top then the stratigraphic column will display according to faulting as well.
Understanding the stratigraphy, the expected rock types, and the sequence of rocks that can be found in a region is beneficial for interpreting well data. The ability to display the full Stratigraphic Column automatically in a well when surface picks are interpreted means that the interpretation style does not need to be changed to get the stratigraphy to display correctly and the interpretation of well tops is sped up. Stratigraphy becomes easier to integrate into the geoscientist’s workflow and will help to guide and standardize their interpretation and highlight stratigraphic anomalies during validation. Displaying the stratigraphy helps visualize how the strata change from well to well, check the geological plausibility of the interpretation, and compare the well interpretation with seismic data and interpretations. This helps ensure that the reservoir is well modelled which reduces the drilling risk so that hydrocarbon targets are more likely to be successful.
The data in the images is from the Volve field provided by Equinor and the former Volve License partners through Equinor’s Open Data License. (www.equinor.com/energy/volve-data-sharing)
Terms and conditions can be found here.