October 28, 2022
The use of structural data is vital when building subsurface models, and the latest update to the Geosciences Suite, a DecisionSpace® 365 solution now includes image logs, dip classes, and dip zone visualization in the correlation view. Adding these new features ensures that structural analysis can now be visualized and integrated into a well correlation workflow. This data helps identify changes in the rock that might not be apparent in other data types and can help validate seismic structures, therefore providing more information to help ensure that the subsurface model is robust and reservoir targets are optimal. In addition, visualizing this data is essential for cross-discipline collaboration among petrophysicists, structural geologists, and geoscientists, and ensures that all structural data from the well can be used to improve decision-making.
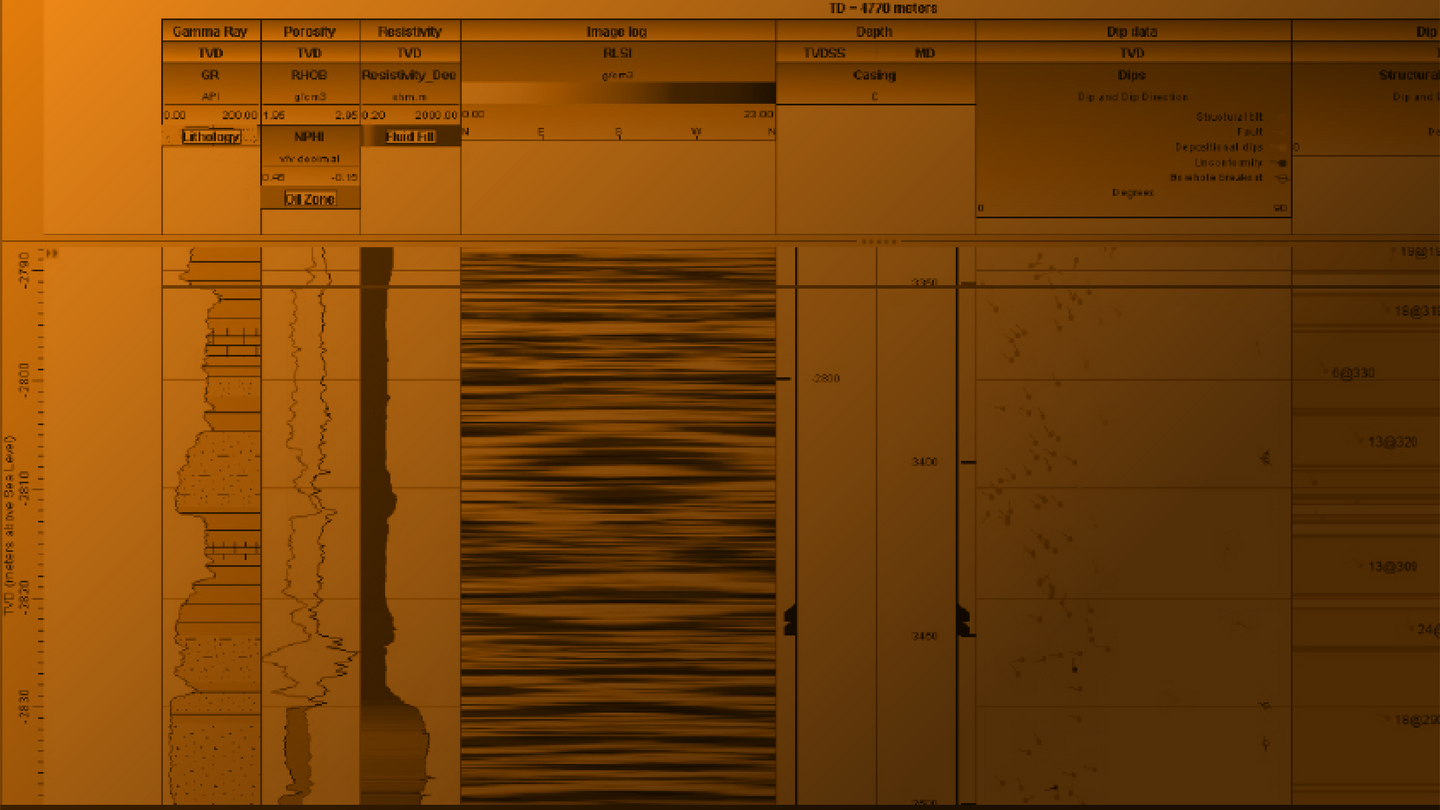
With the unique advantages of image logs, interpretation tools should be capable of handling the visualization of this log type. When viewed alongside other wellbore data types, image logs can inform the geoscientist of the sub-seismic structure and sedimentology of a well, and act as a quality check aid for the dip interpretations. This leads to a more thorough understanding of the geology (Figure 1).
Dip data captures the interpretation made on the image log and the addition of the new Class option for the Tadpole Display Style allows various dip categories to be easily identified in the well. It is possible to filter by class to focus on specific data that is needed for interpretation e.g., the dip class for Structural Tilt can be used to identify where to interpret well tops.
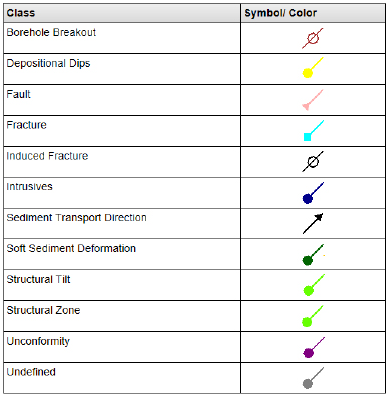
Dip categories have been standardized into twelve classes (Figure 2) which allow different datasets with mismatching nomenclature to be mapped to a standard, and therefore helps to reduce complexity in the database. This also ensures that the data is in a robust framework for future changes to the nomenclature.
Dip zones display over an interval in the well and a dip zone is an interpretation of a group of dip data with a similar trend. This facilitates the interpretation of stratigraphy and structure in a well as the data is already compartmentalized and could indicate different strata.
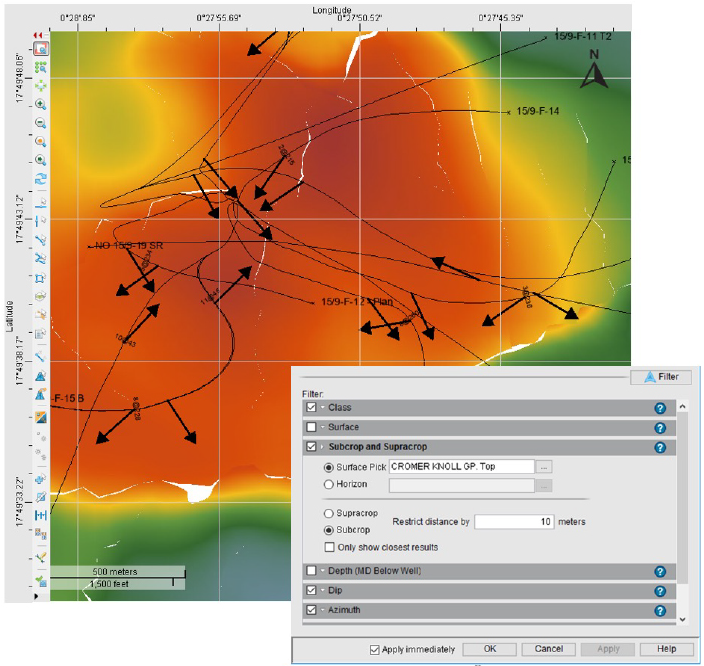
Dip data can also be displayed in map view which allows spatial distribution of the data to be analyzed. This is particularly useful for sediment transport dip data and can help explain trends in sedimentary structures in wells across an asset. In map view, there is an additional filter that screens out the data above (supracrop) and below (subcrop) a well top or horizon. This way, it becomes easier to identify which well interval or strata the dip data can be found in (Figure 3). The other dip data filters include dip and dip direction, quality, percent change, and average, to help enable a thorough analysis of the data.
These new data types that have been added to the Geosciences Suite solution, allow the geoscientist to help unlock detailed structural and sedimentary well analysis and leverage this knowledge for better well interpretations. The addition of this data can help support a pre-existing interpretation of a formation, identify new strata or faults, or give an insight into whether a bed pinches out or maintains its stratigraphic thickness. This knowledge impacts our understanding of the size and location of potential reservoirs and therefore is useful for identifying hydrocarbon targets and optimizing field development plans.
The data in the images is from the Volve field provided by Equinor and the former Volve Licence partners through Equinor’s Open Data License. (https://www.equinor.com/energy/volve-data-sharing)